
This post appeared as a guest article in the JASP Services website.
When you’re learning about Lean Six Sigma and preparing to run a DMAIC project, there are many obstacles to overcome. Some obstacles present learning opportunities because they make you think and help you gain valuable experience. Others are just painful barriers, like the cost of software, unfriendly user interfaces, or software that only works on certain platforms. I want my LSS learners focused on the learning opportunities rather than the painful barriers.
That’s why I created my new LSS and JASP training. As JASP’s own tagline puts it, JASP is free, friendly, and flexible. Learners don’t have to worry about cost, complicated menus, or whether the software will run on their computer.
In this post I share why JASP works well for LSS training, how the analyses map onto DMAIC, a healthcare example my learners love, and my experience with JASP.
Why JASP fits Lean Six Sigma, especially in healthcare
Hospitals run on tight budgets, and statistics software licenses are an easy line item to cut. When learners finish Green Belt or Black Belt training and return to their unit, they need to keep analyzing data, not wait for budget approval. JASP removes that barrier. The advantages are clear:
It’s free, now and later. Learners install JASP on their own computers and keep using it on their projects after the class ends. No license server, no annual renewal.
It’s friendly. Healthcare professionals are rarely statisticians. Drag-and-drop variables and clean, readable output let them focus on what the data say about their patients and processes, not on the software.
It’s flexible. JASP runs on Windows, Mac, and Linux, so almost anyone can use it. When everyone uses the same free tool, improvement teams can share data files and analyses without worrying about who has a license.
It covers what Belts need. The Quality Control module includes control charts, process capability, measurement systems analysis, and designed experiments. JASP’s other modules cover descriptive statistics, hypothesis tests, and correlation/regression.
Mapping JASP to DMAIC
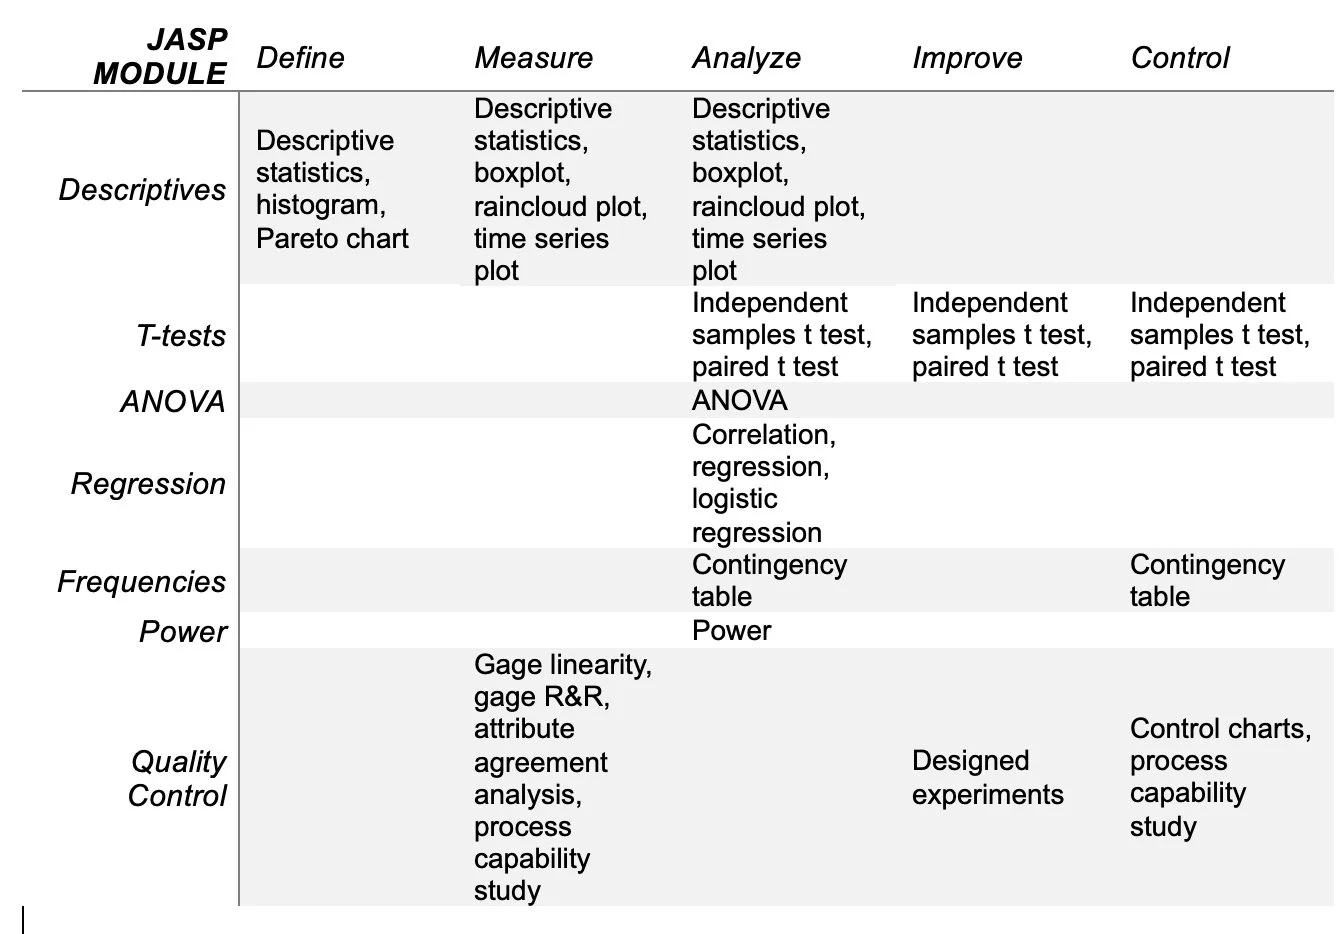
JASP covers nearly everything Green Belts and Black Belts need to analyze data in a curriculum that is geared to the ASQ and IASSC bodies of knowledge.
Lean tools such as value stream maps stay on paper. Project tools such as SIPOCs, stakeholder management plans, and FMEA stay in Excel. JASP handles the statistics and the graphs.
An example: emergency department wait times
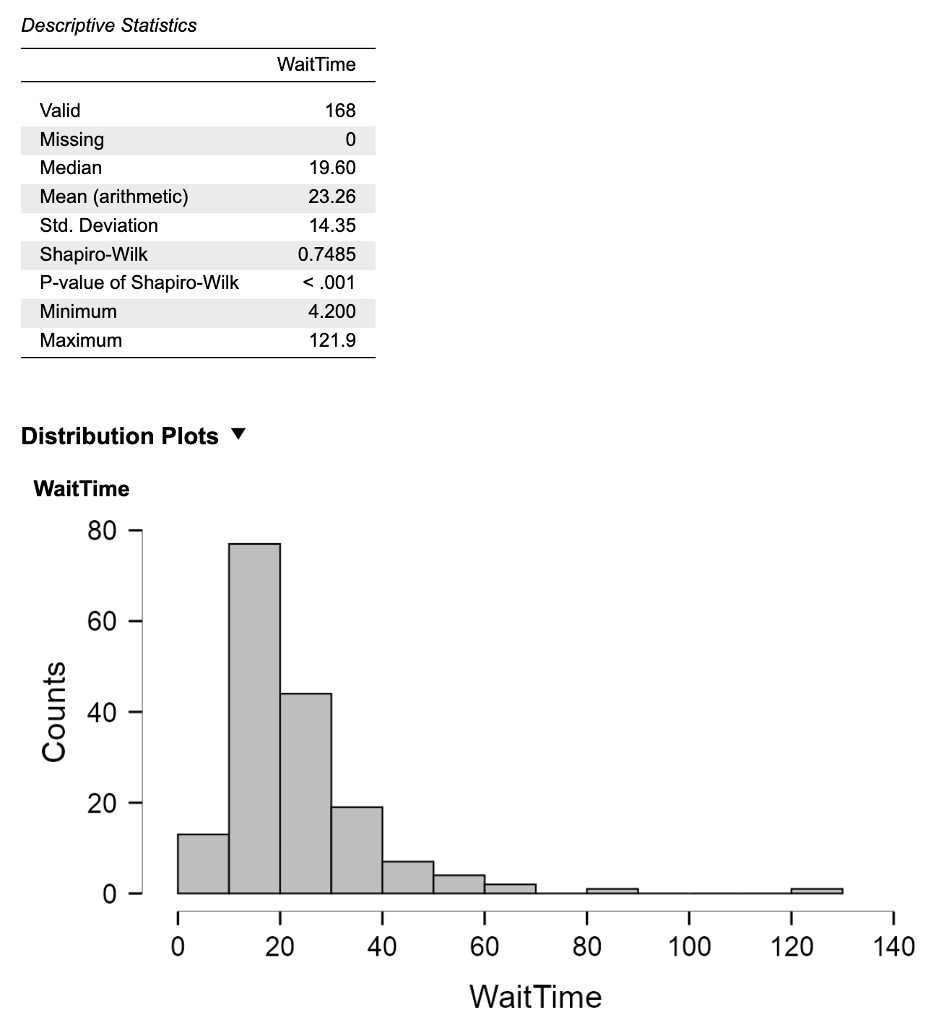
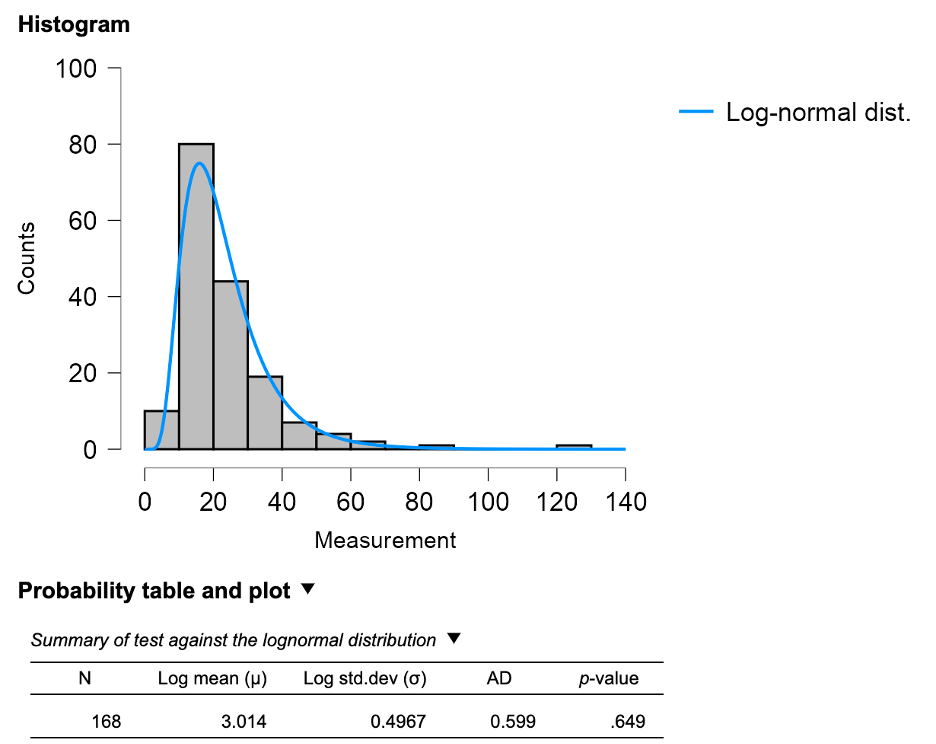
1. Plotting the data. Learners start with Descriptives and a histogram. Right away they see the long right tail: most patients are seen quickly, but a few wait much longer.
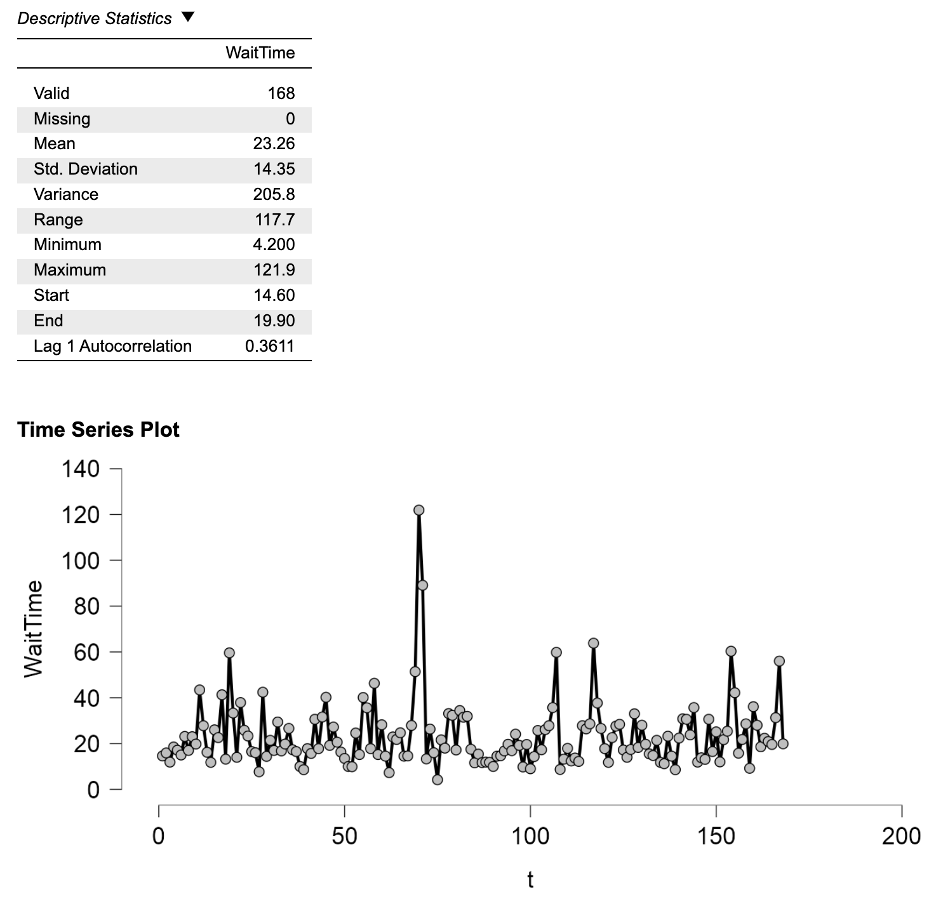
2. Checking the process stability. Next, they create a time series plot. The question becomes “Is the process behaving predictably?” They start paying attention to outliers, instabilities, and patterns in the data.
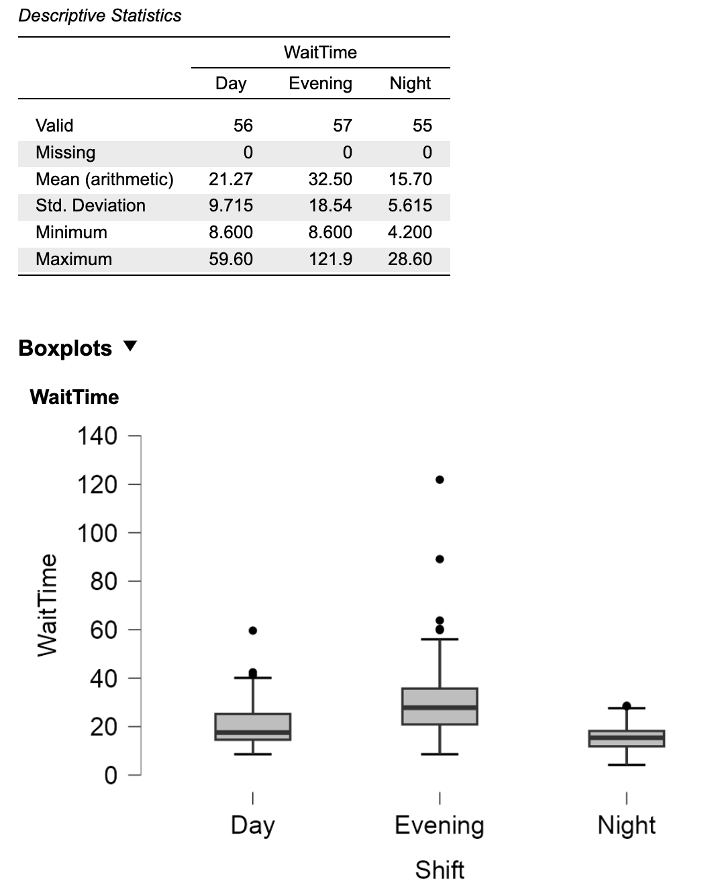
3. Stratifying the data. Splitting the data by shift with boxplots or raincloud plots often shows that the problem isn’t everywhere; it’s concentrated. That shifts the team from blaming people to studying the process. In this data set, the evening shift averages 32.5 minutes, compared with 21.3 on the day shift and 15.7 on the night shift, and it has most of the longest waits.
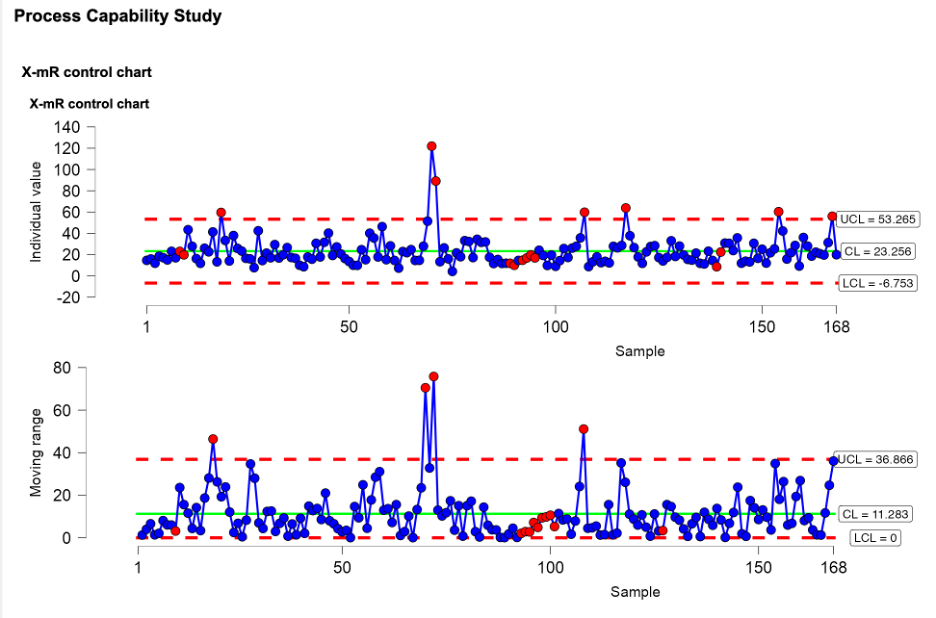
4. Studying process capability. Finally, learners compare the process to the 30-minute upper spec limit using process capability analysis. They learn that they should first check for instabilities using a control chart, which is built right into the capability analysis.
The control chart flags several out-of-control points, including two very long evening-shift waits of about 90 and 120 minutes. That’s a teaching moment: until the process is stable, the capability results describe how the process has performed, not what it will reliably do.
They already know the data is not normal, so they identify another distribution that fits the data. In this example, a lognormal distribution is an acceptable fit.
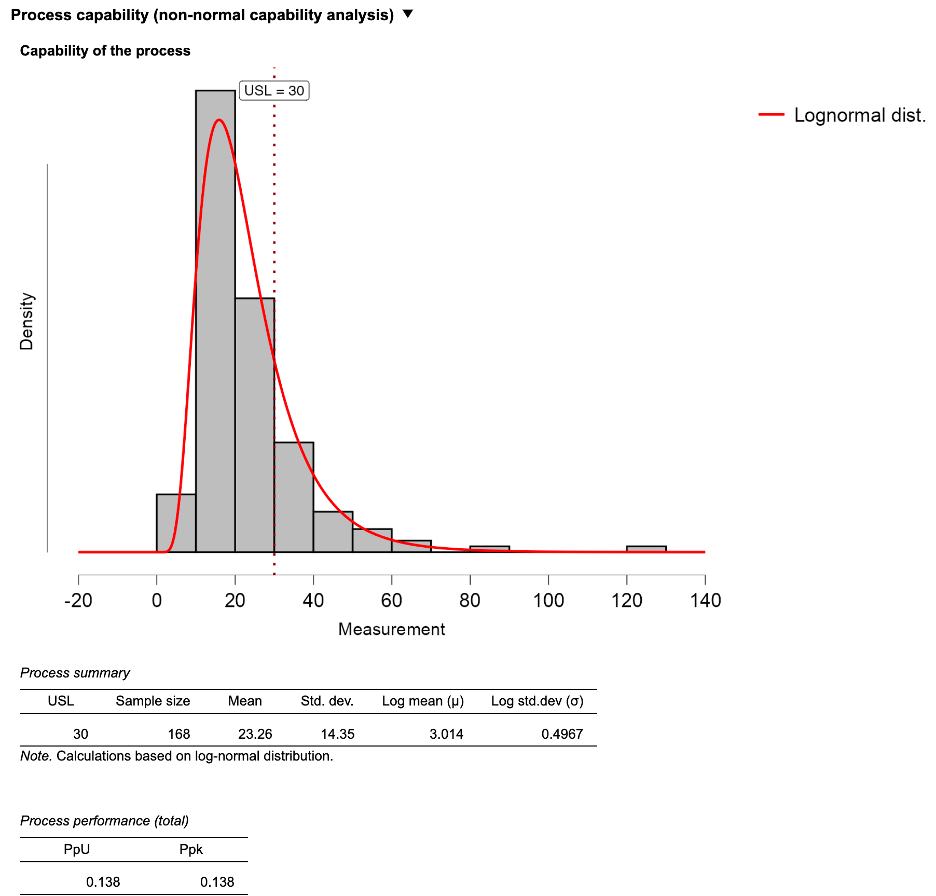
Then they see the results: a Ppk of only 0.14, which means about one patient in five waits longer than 30 minutes. Because waiting times are rarely normally distributed, this is a natural moment to discuss non-normal capability, which JASP supports.
By the end, learners have told a complete data story in one free tool, and they can repeat it with their own real data when they return to work.
My experience with LSS and JASP training materials
I’m very happy with the way JASP breaks down the unhelpful barriers. I don’t have to worry any longer about learners not being able to afford the software or not having the right operating system. It’s easy to import data or copy and paste it into JASP. Learners focus on the meaning of the analysis rather than on the right sequence of clicks. The output is clean, professional, and customizable. Learners who have used other statistics programs can’t believe how easy it is to use. Fewer unhelpful barriers mean more productive learning and faster project completion.
About the author. Sarah Carleton is a certified Lean Six Sigma Master Black Belt and IASSC-accredited trainer with more than 25 years of experience in healthcare, manufacturing, government, and software. She led Philips’ global Lean Six Sigma training program for ten years and is the author of five GOAL/QPC Memory Jogger books. Her next book, The Lean Six Sigma and JASP Memory Jogger (GOAL/QPC), is coming soon. She offers a licensable Green Belt and Black Belt curriculum taught entirely in JASP at sarahacarletonconsulting.com.