
WHY JASP
Real Lean Six Sigma statistics. No software to buy.
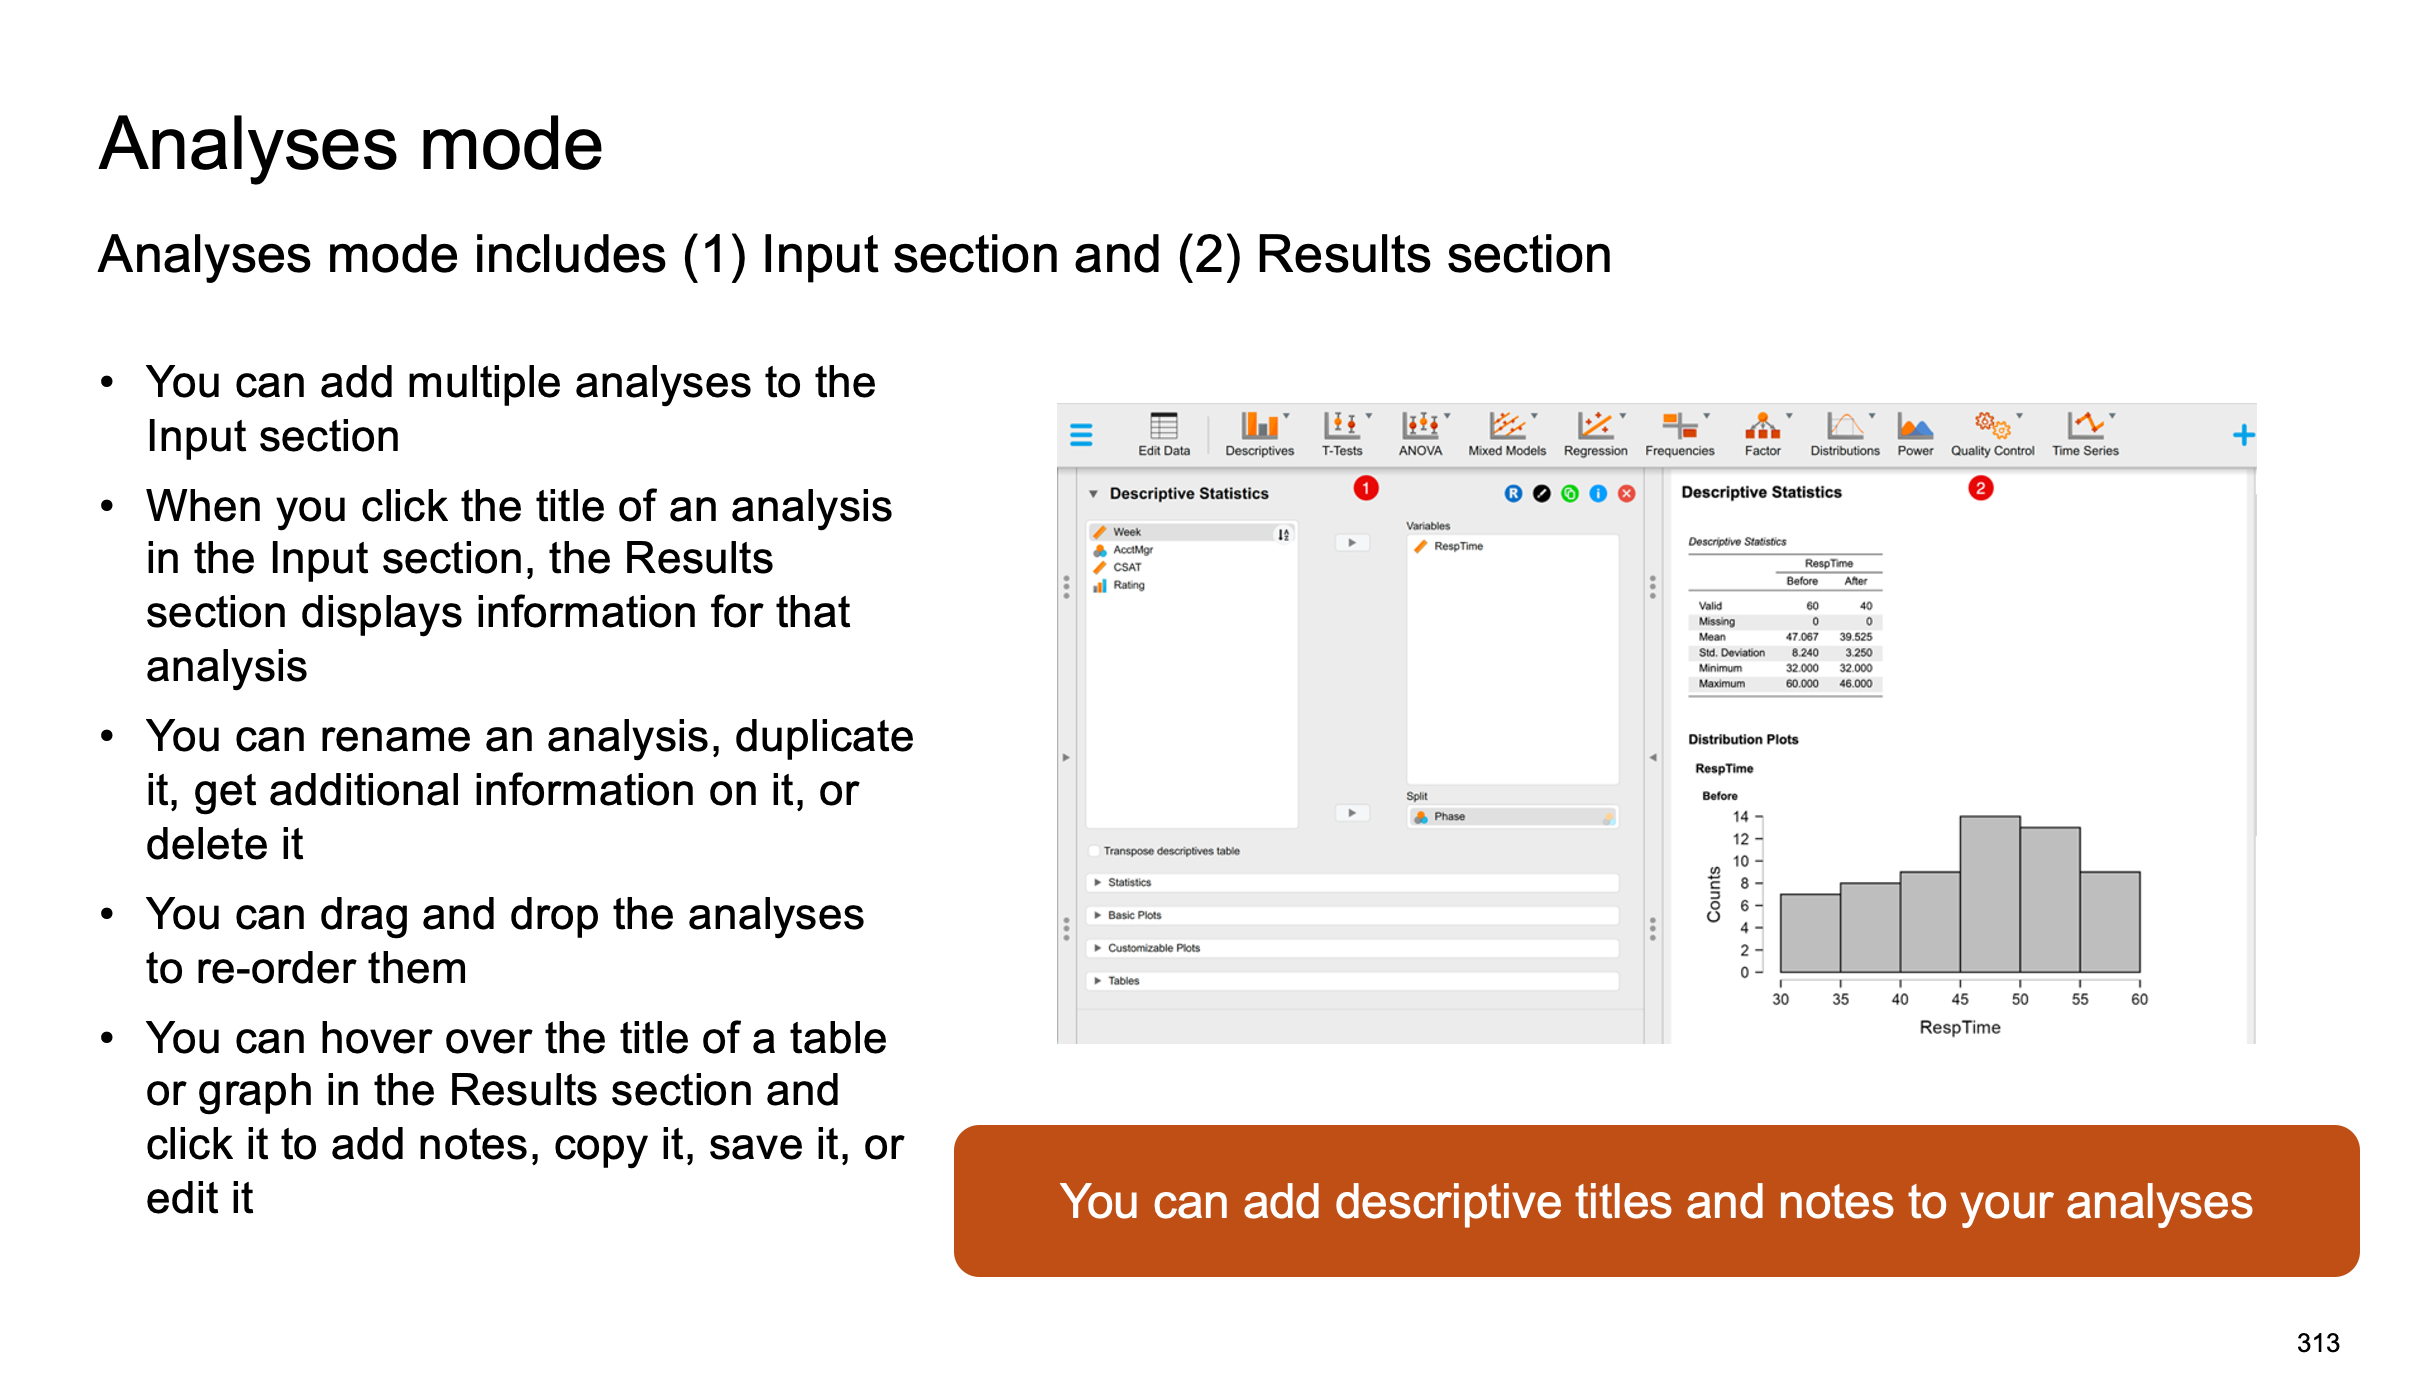
Learners run every analysis in JASP, free, open-source statistics software supported by the University of Amsterdam. It has the tools a Green Belt or Black Belt needs, with none of the license costs.
WHAT SETS IT APART
$0
Free
Open-source statistics software. No software license costs for you or your learners, and nothing to renew each year.
Friendly
Drag-and-drop analysis and clear output, so learners focus on the thinking, not the tool. No coding required.
Flexible
Runs on Windows, Mac, and Linux, and keeps working after training ends, so learners keep using what they learned.
A PERFECT FIT FOR LEAN SIX SIGMA
The analyses your belts need, across DMAIC
JASP's Quality Control module adds measurement systems analysis, control charts, capability studies, and designed experiments to its core statistics. Here's where they show up in a project.
DEFINE
Understand the problem
Descriptive statistics
Histograms and time series plots
Pareto charts
MEASURE
Trust the data
Type 1 gage studies
Gage R&R
Attribute agreement analysis
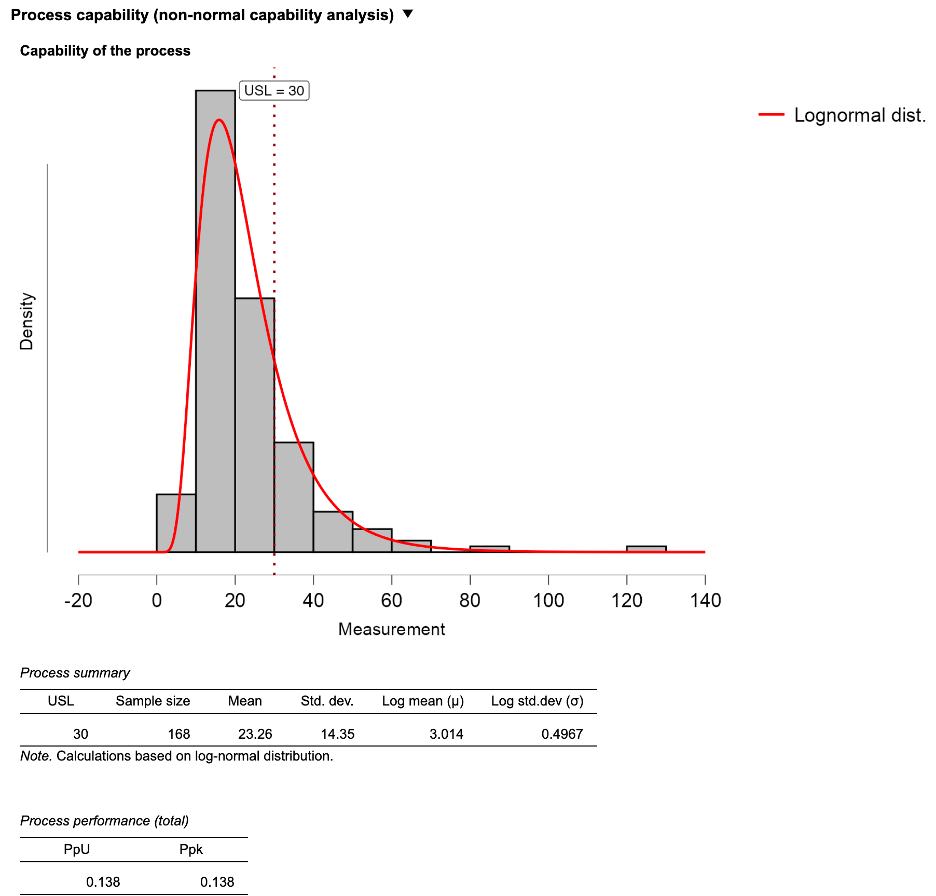
Process capability (normal and non-normal)
ANALYZE
Find root causes
t-tests
ANOVA
Correlation and regression
Chi-square tests
IMPROVE
Test solutions
Factorial designs
Response surface designs
CONTROL
Hold the gains
Shewhart control charts
EWMA and CUSUM charts
Laney P’ and U’ charts
Capability follow-up
BETTER FOR LEARNING
Learners see cause and effect as they work
In JASP, results update the moment a learner changes a setting. Add a variable, switch a test, or change a spec limit, and the output changes right beside it. That makes it easy for instructors to ask "what if?" and for learners to see the answer.
Results update in real time as settings change
Clean, publication-style tables and plots
Point-and-click menus, with no programming
Classical and Bayesian versions of standard tests
SEE HOW TO MAKE A CONTROL CHART IN JASP
An example of how to make a control chart in JASP. There is no audio in this video.
389
universities use JASP in their curricula
Source: JASP, 2026
77
countries
0
software licenses to buy
AS FEATURED ON THE JASP BLOG
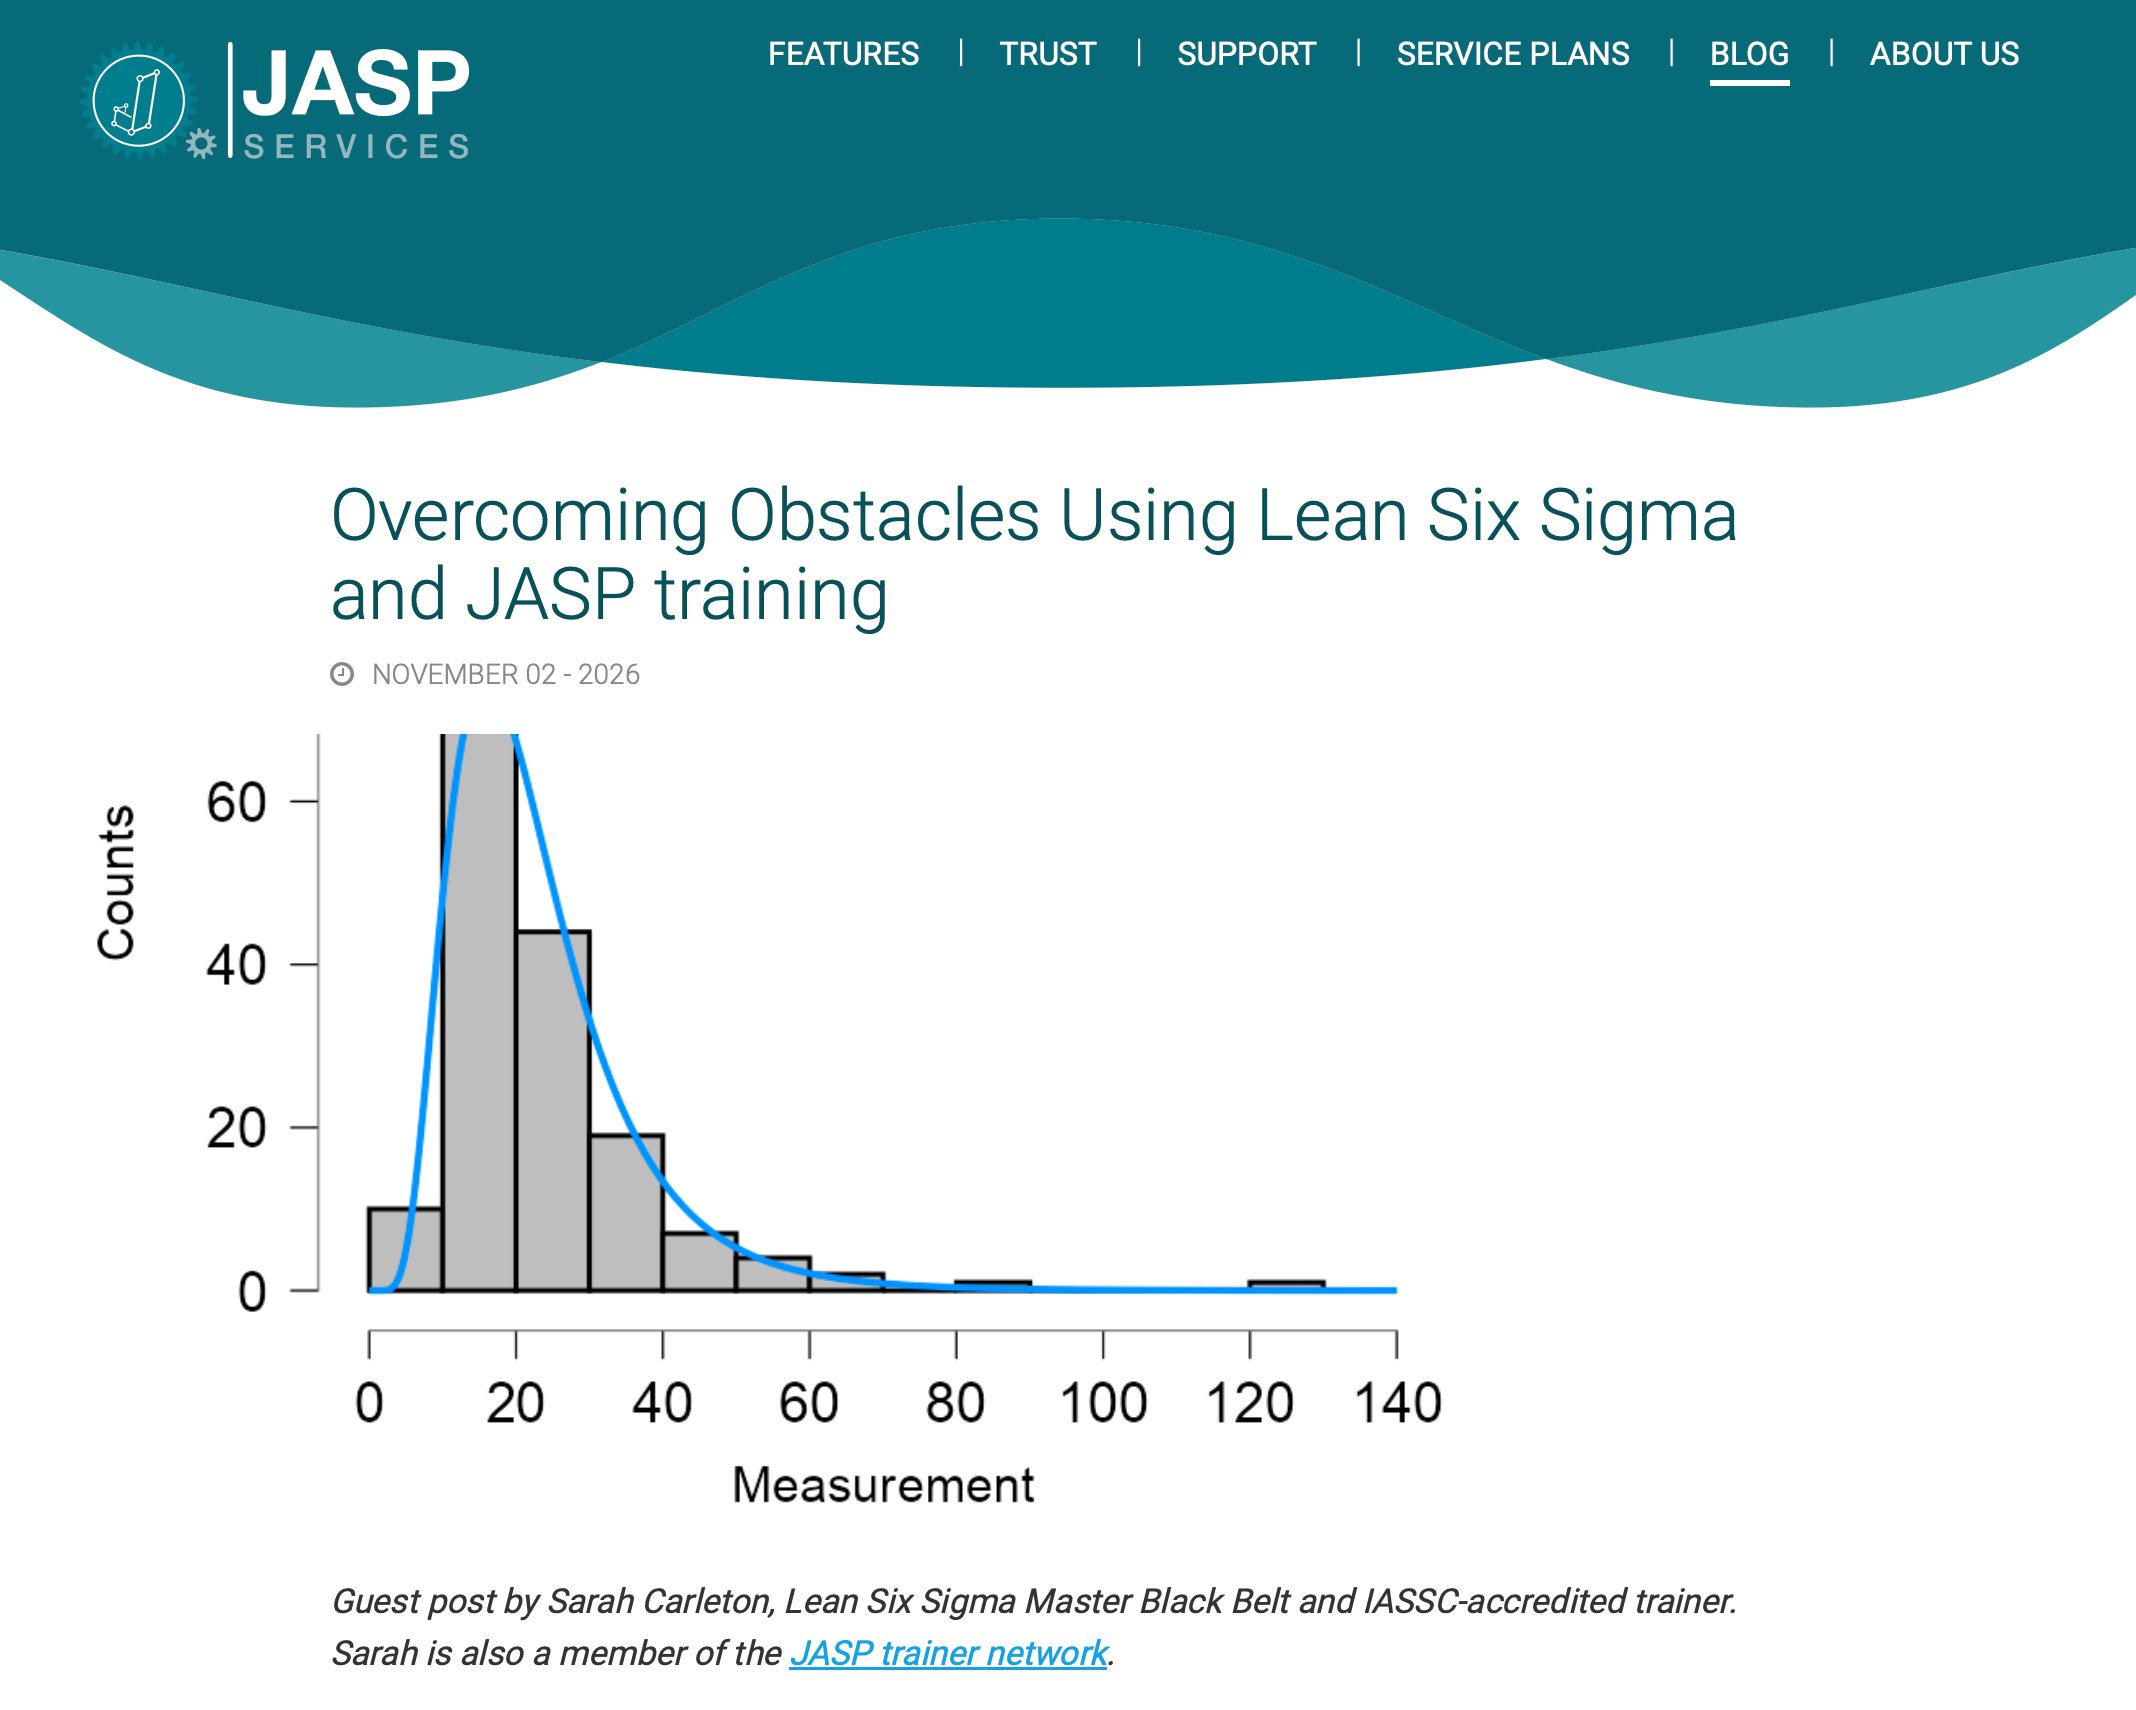
Overcoming obstacles with Lean Six Sigma and JASP training
Sarah's guest post on teaching Lean Six Sigma with JASP, published by the JASP team.
COMMON QUESTIONS
JASP questions
Is JASP really free?
Yes. JASP is open-source software, free to download and use. There is no license to buy for instructors or learners, and nothing to renew.
Do learners need to know how to code?
No. Every analysis is done through menus and drag-and-drop, so learners spend their time on the statistics, not the software.
Can JASP handle Six Sigma work, not just basic statistics?
Yes. Its Quality Control module covers measurement systems analysis, control charts, process capability, and designed experiments.
Our organization already uses other statistical software. Does that matter?
If your trainers already know other software, they will pick up JASP very quickly. The next time your license is up for renewal, consider switching over to JASP entirely.
See JASP in a real lesson
Request a sample module to see how learners move from the slides to a live analysis in JASP.